[astropark] Fair Value GapsDear Followers,
today a new epic tool, the "Fair Value Gap (FVG) Finder" .
Fair Value Gaps are quite important to trade, as they represent both volume and trading unfilled gaps, which most of the time are filled and then price reverse .
This indicator will let you set alerts on when a new FVG is found and when it is filled.
Traded together with Breaker Blocks (BB) and Supply/Demand Order Blocks (OB) , you can easily spot important points where to start a short or a long trade.
Here my Breaker Blocks (BB) and Supply/Demand Order Blocks (OB) indicator
Here below some examples on how to use the indicator.
On Bitcoin
On EURUSD
Search in scripts for "order block"

Futures Confluence Delta (FCD) - Histogram
The Futures Confluence Delta (FCD) Histogram is a powerful trend-following indicator tailored for scalping futures on 1-minute charts. Displayed in a bottom panel like RSI or volume, it visualizes cumulative volume delta to identify bullish or bearish market momentum. The histogram turns green for positive delta (buying pressure, suggesting a long trend) and red for negative delta (selling pressure, indicating a short trend), providing quick insight into market direction.
This indicator is ideal for futures traders seeking confluence with other tools, such as VWMA or order block strategies. It uses a simple yet effective delta calculation (buy volume for up candles, sell volume for down candles, smoothed with EMA) to highlight trend strength, making it perfect for fast-paced scalping environments.
Key Features:
Cumulative Delta Histogram: Tracks buying vs. selling pressure, smoothed with an EMA for clarity.
Color-Coded Trend Signals: Green for bullish (long) trends, red for bearish (short) trends.
Customizable Settings: Adjust the delta lookback period and enable/disable daily reset for flexibility.
Optimized for 1-minute charts on futures.
Alert Support: Set alerts for trend changes to stay ahead of market shifts.
How to Use:
Add the indicator to your 1-minute chart. Observe the histogram in the bottom panel:
Green bars (positive delta) suggest a bullish trend, favoring long entries.
Red bars (negative delta) indicate a bearish trend, favoring short entries.
Combine with other indicators (e.g., VWMA, order blocks, or FVGs) for confluence.
Set alerts for trend changes via the FCD Long Trend or FCD Short Trend conditions.
Adjust settings (delta lookback, daily reset) to match your trading style.
Settings:
Delta Lookback Period (default: 14): Controls the EMA smoothing of the delta. Lower values increase sensitivity; higher values smooth trends.
Reset Delta Daily (default: true): Resets cumulative delta at the start of each trading day for futures session alignment.
Long Color (default: green): Color for bullish delta.
Short Color (default: red): Color for bearish delta.
Notes:
Ensure sufficient historical data (500+ bars) for accurate delta calculations.
Test on NQ for higher volatility, as it may show stronger delta signals compared to GC or ES.
Check the Pine Logs pane (“More” > “Pine Logs”) for any NA data issues if the histogram doesn’t display.
Share your feedback or suggestions in the comments!

Scalp Nakurviator v1.2 (Public Version)
Summary
Nakurviator - Scalp Signal Indicator
A fast, HTF-aware scalp signal indicator optimized for 15m and 1h timeframes.
Nakurviator combines rapid local momentum/exhaustion signals with higher-timeframe context (1H, 4H, 1D) to produce concise LONG/SHORT scalp alerts and visual invalidation levels.
How it works (high level):
Local components (RSI, MACD, MFI, volume) tuned for fast reaction and exhaustion detection.
HTF proxies (Order Blocks, FVG, MSS) fetched via request.security and converted to weighted contributions.
Composite scoring: components sum to a raw score, optionally normalized to recent activity, and mapped to -100..100 percent.
Event-driven signals: one label per bar, duplicate-reduction, optional stronger-than-previous requirement.
Optional invalidation lines: micro-pivot + ATR buffer with a labeled price level.
Main features:
Fast local signals with exhaustion weighting (RSI/MFI emphasized).
HTF context from 1H/4H/1D with configurable weights.
Order Block and FVG proxies plus MSS/CHoCH detection.
Dynamic scaling to spread signal percentages.
Signal deduplication and clutter reduction (remove similar recent labels).
Invalidation horizontal lines with precise "Invalidation price" label.
Hover tooltip breakdown showing component contributions.
Visualization & UX:
Overlay indicator so signals appear above price.
Labels anchor to bars; invalidation label precision formatted for small prices.
Configurable label offset and ATR-based vertical offset to keep labels visually near lines when zoomed.
Recommended usage
Use on 5m or 15m charts; the indicator warns if used on other timeframes.
Tune `show_threshold` and HTF weights to control signal frequency and HTF bias.
Use invalidation lines as suggested stop/invalid levels combined with your risk management.
//@version=6
indicator("Nakurviator Scalp", shorttitle="NScalp", overlay=true)
// Local + HTF scoring -> combined_percent
Inputs: `min_score`, `show_threshold`, `use_dynamic_scaling`, `h1_weight`, `h4_weight`, `d1_weight`, `inv_atr_mult`, `inv_label_bar_offset`.

smcCore Positioning
A comprehensive trading tool integrating trend tracking, price action, and Smart Money Concepts (SMC). Suitable for multiple assets like cryptocurrencies and forex, it specializes in scalping and swing trading, directly usable on the TradingView platform.
Key Features
Trend Identification
Supertrend: Generates buy/sell signals (🚀 for long, 🐻 for short) when price crosses the trend channel, indicating trend direction.
Cirrus Cloud: Green denotes bullish trends, red for bearish trends, visually reflecting trend strength.
Market Structure Analysis
Identifies BOS (Break of Structure) and CHoCH (Change of Character) to mark short-term (internal structure) and long-term (swing structure) price turning points.
Order Blocks (OB) & Fair Value Gaps (FVG): Highlights institutional capital concentration zones and price gaps, signaling potential support/resistance levels.
Risk Management
Automatically calculates 3 take-profit levels (TP1-TP3) and 1 stop-loss (SL), dynamically adjusted based on ATR. Specific prices and lines are displayed on the chart.
Auxiliary Tools
ADX Indicator: Judges trend strength; purple marks sideways ranges (low signal reliability).
Multi-timeframe compatibility: Optimized for 15-minute charts to adapt to high volatility in cryptocurrencies, with adjustable parameters to filter noise.
Use Cases
Scalping: Combine 15-minute FVG fills and order block breakouts for quick entries/exits.
Swing Trading: Leverage trend cloud + structure breakout signals to capture medium-term trends.
Suitability: Ideal for traders comfortable with short-term volatility and basic technical analysis.
Ayman Entry Signal – Ultimate PRO (Scalping Gold Settings)1. Overview
This indicator is a professional gold scalping tool built for TradingView using Pine Script v6.
It combines multiple price action and technical filters to generate high-probability Buy/Sell signals with built-in trade management features (TP1, TP2, SL, Break Even, Partial Close, Stats tracking).
It is optimized for XAUUSD but can be applied to other assets with proper setting adjustments.
2. Key Features
Multi-Condition Trade Signals – EMA trend, Break of Structure, Order Blocks, FVG, Liquidity Sweeps, Pin Bars, Higher Timeframe confirmation, Trend Cloud, SMA Cross, and ADX.
Full Trade Management – Auto-calculates lot size, SL, TP1, TP2, Break Even, Partial Close.
Dynamic Chart Drawing – Entry lines, SL/TP lines, trade boxes, and real-time PnL.
Statistics Panel – Tracks wins, losses, breakeven trades, and total PnL over selected dates.
Customizable Filters – All filters can be turned ON/OFF to match your strategy.
3. Main Inputs & Settings
Account Settings
Capital ($) – Total trading capital.
Risk Percentage (%) – Risk per trade.
TP to SL Ratio – Risk-to-reward ratio.
Value Per Point ($) – Value per pip/point for lot size calculation.
SL Buffer – Extra points added to SL to avoid stop hunts.
Take Profit Settings
TP1 % of Full Target – Fraction of TP1 compared to TP2.
Move SL to Entry after TP1? – Activates Break Even after TP1.
Break Even Buffer – Extra points when moving SL to BE.
Take Partial Close at TP1 – Option to close half at TP1.
Signal Filters
ATR Period – For SL/TP calculation buffer.
EMA Trend – Uses EMA 9/21 crossover for trend.
Break of Structure (BoS) – Requires structure break confirmation.
Order Block (OB) – Validates trades within OB zones.
Fair Value Gap (FVG) – Confirms trades inside FVGs.
Liquidity Sweep – Checks if liquidity zones are swept.
Pin Bar Confirmation – Uses candlestick patterns for extra confirmation.
Pin Bar Body Ratio – Controls strictness of Pin Bar filter.
Higher Timeframe Filters (HTF)
HTF EMA Confirmation – Confirms lower timeframe trades with higher timeframe trend.
HTF BoS – Confirms with higher timeframe structure break.
HTF Timeframe – Selects higher timeframe.
Advanced Filters
SuperTrend Filter – Confirms trades based on SuperTrend.
ADX Filter – Filters out low volatility periods.
SMA Cross Filter – Uses SMA 8/9 cross as filter.
Trend Cloud Filter – Uses EMA 50/200 as a cloud trend filter.
4. How It Works
Buy Signal Conditions
EMA 9 > EMA 21 (trend bullish)
Optional filters (BoS, OB, FVG, Liquidity Sweep, Pin Bar, HTF confirmations, ADX, SMA Cross, Trend Cloud) must pass if enabled.
When all active filters pass → Buy signal triggers.
Sell Signal Conditions
EMA 9 < EMA 21 (trend bearish)
Same filtering process but for bearish conditions.
When all active filters pass → Sell signal triggers.
5. Trade Execution & Management
When a signal triggers:
Lot size is auto-calculated based on risk % and SL distance.
SL is placed beyond recent swing high/low + ATR buffer.
TP1 and TP2 are calculated from the SL using the reward-to-risk ratio.
Break Even: If enabled, SL moves to entry price after TP1 is hit.
Partial Close: If enabled, half of the position closes at TP1.
Trade Exit: Full exit at TP2, SL hit, or partial close at TP1.
6. Chart Display
Entry Line – Shows entry price.
SL Line – Red dashed line at stop loss level.
TP1 Line – Lime dashed line for TP1.
TP2 Line – Green dashed line for TP2.
PnL Labels – Displays real-time profit/loss in $.
Trade Box – Visual area showing trade range.
Pin Bar Shapes – Optional, marks Pin Bars.
7. Statistics Panel
Stats Header – Shows “Stats”.
Total Trades
Wins
Losses
Breakeven Trades
Total PnL
Can be reset or filtered by date.
8. How to Use
Load the Indicator in TradingView.
Select Gold (XAUUSD) on your preferred scalping timeframe (1m, 5m, 15m).
Adjust settings:
Use default gold scalping settings for quick start.
Enable/disable filters according to your style.
Wait for a Buy/Sell alert.
Confirm visually that all desired conditions align.
Place trade with calculated lot size, SL, and TP levels shown on chart.
Let trade run – the indicator manages Break Even & Partial Close if enabled.
9. Recommended Timeframes
Scalping: 1m, 5m, 15m
Day Trading: 15m, 30m, 1H
Swing: 4H, Daily (adjust settings accordingly)

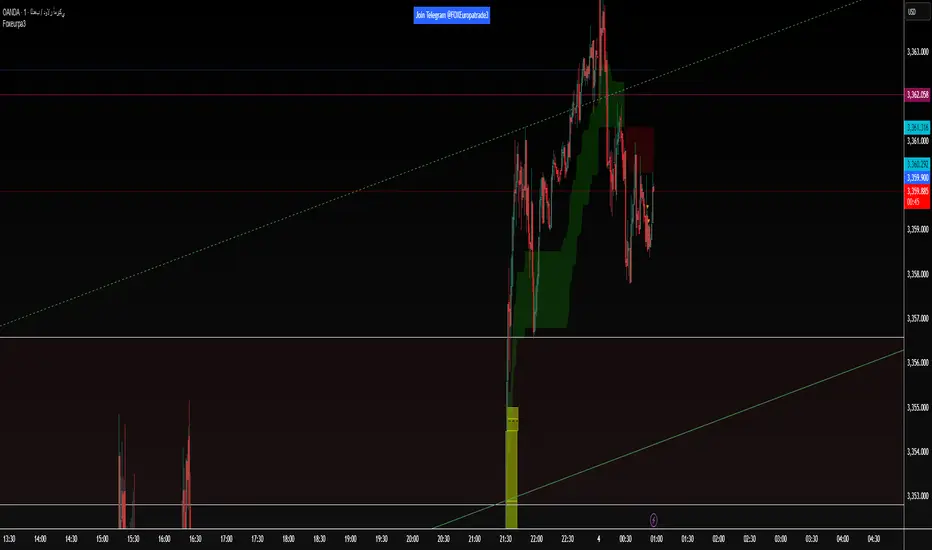
Foxeurpa3The foxEurope indicator shows you liquidity zones, fair value gaps, and order blocks.”
The foxEurope indicator shows you liquidity zones, fair value gaps, and order blocks.”
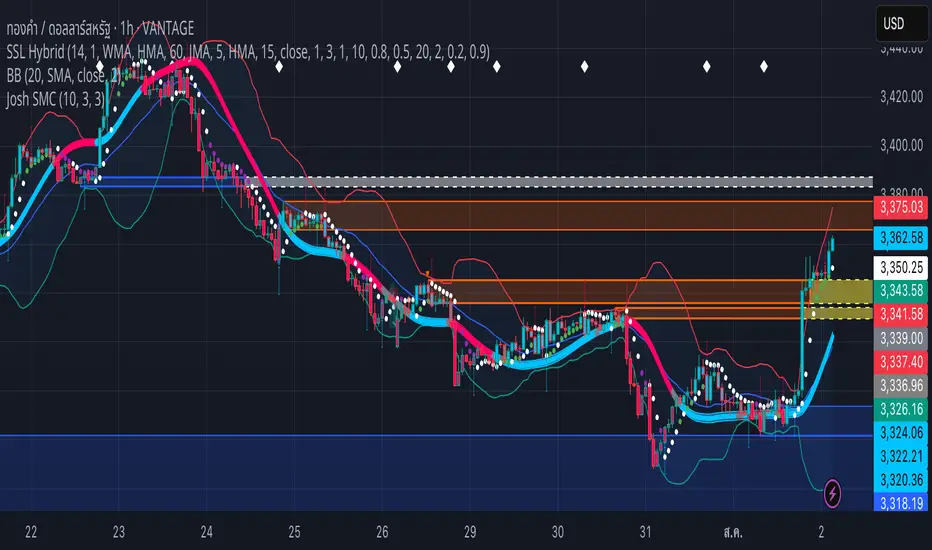
Josh SMC Key Features of Josh SMC
✅ Automatically detects Order Blocks (OB) — both Bullish and Bearish
✅ Accurately identifies Fair Value Gaps (FVG) and tracks whether they are “filled” or not
✅ Detects Change of Character (CHOCH) to signal potential trend reversals
✅ Analyzes price structure in real-time based on Smart Money Concepts
✅ Beginner-friendly, yet powerful for advanced traders
✅ Customizable zone colors and number of OB/FVG displays
✅ Works on all timeframes from 1-minute and up
📌 What You’ll Gain from Using Josh SMC
🔺 Spot potential reversal zones before the crowd
🔻 Avoid chasing fake trends and getting trapped
🎯 Plan your entries and exits with OB and FVG precision
🚫 Eliminate guesswork from your analysis
🚀 Trade with confidence and structure — like smart money does
🔍 Who Is This For?
Traders who follow Smart Money Concepts (SMC), ICT, or Price Action
Anyone seeking high-quality entry/exit zones
Traders who want to understand how institutions move the market
Josh SMC – Smart Money Concepts Indicator
🔍 เข้าใจเจตนารมณ์ของรายใหญ่ มองเห็นตลาดอย่างมืออาชีพ
🔧 จุดเด่นของอินดี้ Josh SMC
✅ ตรวจจับ Order Block (OB) ทั้งฝั่ง Bullish และ Bearish โดยอัตโนมัติ
✅ แสดง Fair Value Gap (FVG) อย่างแม่นยำ พร้อมระบบตรวจจับว่า FVG ถูก “เติมเต็ม” แล้วหรือยัง
✅ ตรวจจับ Change of Character (CHOCH) เพื่อหาสัญญาณกลับตัวในเทรนด์
✅ ใช้การวิเคราะห์โครงสร้างราคาตามหลัก Smart Money Concept แบบ Real-Time
✅ ใช้งานง่าย เหมาะทั้งเทรดเดอร์มือใหม่และมืออาชีพ
✅ ปรับแต่งสีและจำนวนโซนที่ต้องการแสดงได้อย่างยืดหยุ่น
✅ รองรับ Timeframe ตั้งแต่ 1 นาทีขึ้นไป
📌 สิ่งที่คุณจะได้เมื่อใช้ Josh SMC
🔺 มองเห็นจุดกลับตัวของราคาได้ก่อนใคร
🔻 หลีกเลี่ยงการติดดอยจากเทรนด์หลอก
🎯 วางแผนการเข้าออกออเดอร์อย่างแม่นยำตาม OB และ FVG
🚫 ลดความผิดพลาดจากการวิเคราะห์แบบเดาสุ่ม
🚀 เทรดด้วยความมั่นใจและมีระบบ เหมือนรายใหญ่ในตลาด
🔍 เหมาะสำหรับใคร?
เทรดเดอร์สาย Smart Money Concepts (SMC), ICT, Price Action
เทรดเดอร์ที่ต้องการกรอง "จุดเข้า-ออก" คุณภาพสูง
ผู้ที่ต้องการระบบช่วยมองภาพ "พฤติกรรมของรายใหญ่"
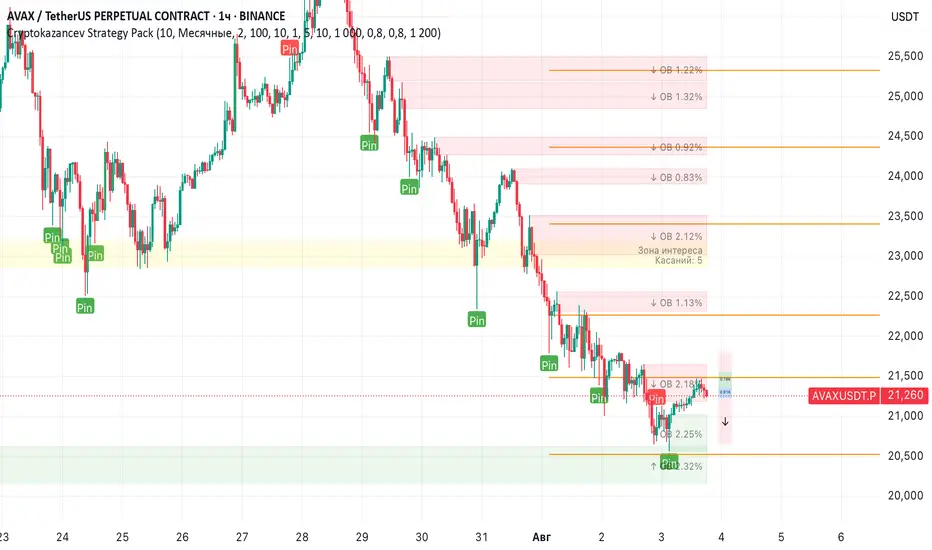
Cryptokazancev Strategy PackCryptokazancev Strategy Pack
Комплексный инструмент для анализа рыночной структуры / Comprehensive Market Structure Analysis Tool
🇷🇺 Описание на русском
Cryptokazancev Strategy Pack by ZeeZeeMon - это мощный набор инструментов для технического анализа, включающий:
• Ордерблоки (Order Blocks) с настройкой количества и цветов
• Пивоты (Pivot Points) различных таймфреймов
• Рыночную структуру с зонами Фибоначчи (0.618, 0.786)
• Разворотные конструкции (пинбары и поглощения)
• Зоны интереса на основе скопления свингов
📊 Основные функции:
1. Ордерблоки
- Автоматическое определение бычьих/медвежьих OB
- Настройка максимального количества блоков (до 30)
- Кастомизация цветов
2. Пивоты
- Поддержка таймфреймов: Дневные/Недельные/Месячные/Квартальные/Годовые
- Уровни Camarilla (P, R1-R4, S1-S4)
3. Рыночная структура
- Четкое определение тренда (UP/DOWN)
- Ключевые уровни Фибо (0.618 и 0.786)
- Настройка глубины анализа (10-1000 баров)
4. Разворотные конструкции
- Обнаружение пинбаров
- Обнаружение поглощений
- Настройка чувствительности
5. Зоны интереса
- Алгоритм кластеризации свингов
- Настройка через ATR-мультипликатор
- Лимит отображаемых зон
🇬🇧 English Description
ZeeZeeMon Pack is a comprehensive market analysis toolkit featuring:
• Order Blocks with customizable count and colors
• Pivot Points for multiple timeframes
• Market Structure with Fibonacci zones
• Reversal patterns (pinbars and engulfings)
• Interest Zones based on swing clustering
📊 Key Features:
1. Order Blocks
- Auto-detection of bullish/bearish OB
- Configurable max blocks (up to 30)
- Custom color schemes
2. Pivot Points
- Supports: Daily/Weekly/Monthly/Quarterly/Yearly
- Camarilla levels (P, R1-R4, S1-S4)
3. Market Structure
- Clear trend detection (UP/DOWN)
- Key Fibonacci levels (0.618 & 0.786)
- Adjustable analysis depth (10-1000 bars)
4. Reversal Patterns
- Smart pinbar detection
- ATR-based engulfing filter
- Sensitivity adjustment
5. Interest Zones
- Swing clustering algorithm
- ATR-multiplier configuration
- Display limit (up to 10 zones)
⚙️ Technical Highlights:
• Built with Pine Script v5
• Performance-optimized
• Well-commented code
• Flexible settings system
⚠️ Важно / Important:
Индикатор в бета-версии. Тестируйте перед использованием в реальной торговле.
This is BETA version. Please test before live trading.
💬 Поддержка / Support:
Комментарии к скрипту / Script comments section
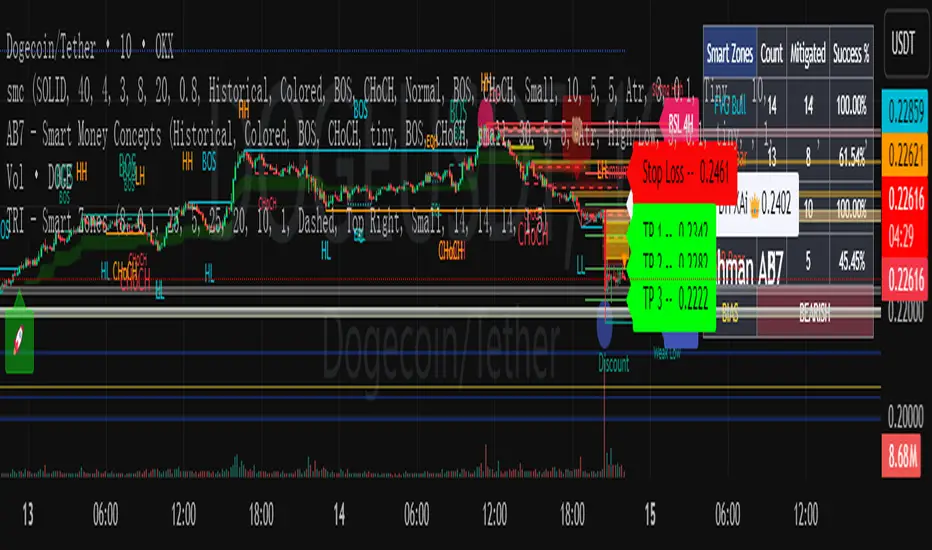
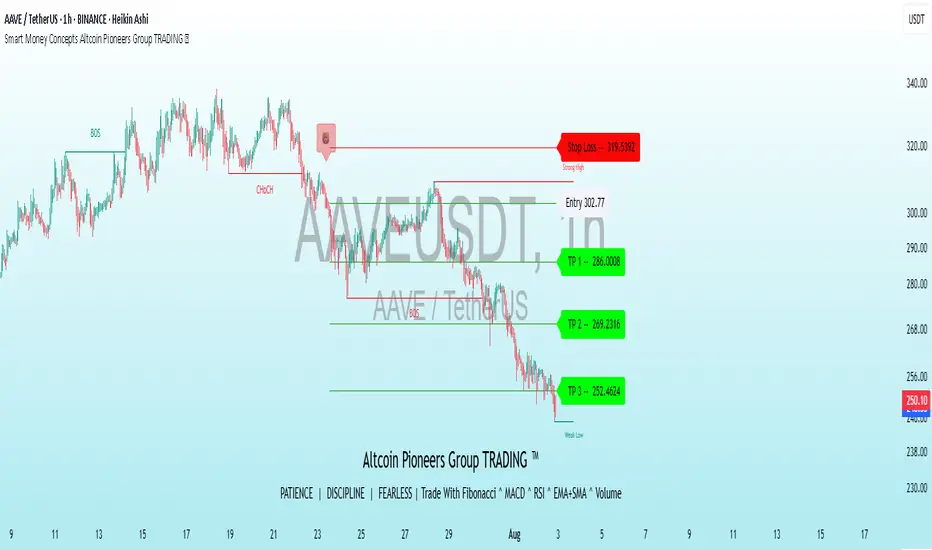
Smart Money Concepts Altcoin Pioneers Group TRADING ™This indicator is a comprehensive trading tool designed for altcoin and crypto traders, combining Supertrend, trend analysis, risk management, and Smart Money Concepts (SMC) to identify high-probability trading setups. It provides clear buy/sell signals, trend visualization, and key price action levels to enhance decision-making across various market conditions.Key FeaturesSupertrend Module:Generates buy () and sell () signals based on Supertrend crossovers with customizable sensitivity (default: 1).
Uses ATR-based bands to adapt to market volatility, helping traders identify trend direction and reversals.
Enhanced with SMA confirmation (8 and 9 periods) for stronger signal reliability.
Trend Cloud & Visualization:Displays a "Cirrus Cloud" using dual ALMA filters (configurable windows and sigma) to highlight trend direction.
Includes a Hull Moving Average (HMA) cloud (600-period) for long-term trend context.
Bar coloring based on Supertrend and ADX (threshold: 15) to indicate trending or sideways markets.
Risk Management:Plots dynamic Take Profit (TP) and Stop Loss (SL) levels based on ATR (default: 3% risk, 14-period ATR).
Customizable TP/SL lines (solid, dashed, or dotted) with adjustable distance and decimal precision.
Supports up to three TP levels for flexible trade exits.
Smart Money Concepts (SMC):Identifies swing and internal market structures (BOS, CHoCH) with customizable display options (Historical or Present mode).
Detects Order Blocks (bullish/bearish, internal/swing) with ATR or cumulative mean range filtering.
Highlights Fair Value Gaps (FVGs), Equal Highs/Lows (EQH/EQL), and Premium/Discount Zones for institutional-level analysis.
Multi-timeframe (MTF) support for previous day/week/month highs and lows.
Additional Features:Trend Tracer lines for short-term price action analysis.
Volume-weighted EMAs (5, 9, 13, 34, 50 periods) for momentum confirmation.
Alerts for buy/sell signals, structure breaks, FVGs, and EQH/EQL formations.
How to UseSetup: Add the indicator to your chart and adjust settings via the Inputs tab.
Signals: Look for (buy) and (sell) labels for trade entries. Confirm with SMA crossovers and trend cloud direction.
Risk Management: Enable TP/SL levels to visualize risk-reward ratios. Adjust ATR Risk % and decimals for precision.
SMC Analysis: Use swing/internal structure and Order Blocks to identify institutional levels. Enable FVGs and EQH/EQL for additional confluence.
Trend Confirmation: Use bar colors (green for bullish, red for bearish, purple for sideways) and ADX to gauge market conditions.
SettingsSupertrend Sensitivity: Adjust nsensitivity (default: 1) for signal frequency.
Cirrus Cloud: Toggle on/off and tweak ALMA parameters (windows: 100/310, sigma: 6/32) for trend clarity.
Risk Management: Customize ATR Length (14), Risk % (3), and TP/SL display options.
SMC Options: Choose between Historical or Present mode, enable/disable FVGs, Order Blocks, and MTF levels.
Visuals: Modify line styles, label sizes, and colors for better chart readability.
Vijay D Education Purpose ndicators Used in the Setup
Order Block Detector
Settings: (5, 3, 3), 1 Wick
Function: Highlights institutional order blocks to identify high-probability supply/demand zones.

ParthFintech SMART Indicator V1.0A powerful, all-in-one SMART indicator designed to identify high-probability trade setups across any timeframe. By combining break-of-structure entries with multi-timeframe trend confirmation, dynamic support & resistance, Order Block (OB) and Fair Value Gaps (FVG ) Detection, it automatically plots your entry, stop loss, and three tiered take-profit levels—and even marks them with arrows and labels so you can act at a glance.
---
A. 🔑 Key Features
1. Break of Structure (BOS) based entries: Detects fresh bullish or bearish structure breaks for precise timing.
2. Multi-Timeframe Trend Filter: Confirms 4 hour and Daily trend alignment via crossovers to avoid counter-trend signals.
3. Dynamic Support & Resistance Zones: Automatically captures the most recent swing highs/lows as S/R levels in the chart.
4. Multiple confluence Detection: Marks recent bullish/bearish order blocks with tiny colored squares.
5. Fair Value Gap (FVG) Zones: Highlights potential liquidity imbalance areas where price often returns.
6. Automated Risk/Reward Levels:
- Entry at the BOS candle high/low
- Stop Loss at the most recent swing low (for longs) or swing high (for shorts)
- TP1, TP2, TP3 calculated as configurable RR multiples (default 1.5×, 2×, 3×)
B. Visual Cues:
- Green arrow below the bar for long entries
- Red arrow above the bar for short entries
- Labels “ENTRY”, “SL”, “TP1”, “TP2”, “TP3” plotted at their respective price levels
- Alert-Ready: Built-in alert conditions for Entry, all three TPs and SL hits—perfect for pop-ups, emails, or webhooks (Telegram integration).
C. ⚙️ Inputs & Customization
Input Default Description
- TP1 RR 1.5 First take-profit as a multiple of risk
- TP2 RR 2.0 Second take-profit multiple
- TP3 RR 3.0 Third take-profit multiple
- Lookback S/R 20 Bars to use when calculating swing highs/lows
- Arrow Offset (pips) 10 Vertical offset for the entry arrows
- HTF 1 240 Higher timeframe #1 (4 hour)
- HTF 2 D Higher timeframe #2 (Daily)
- Customize RR targets, lookback period, arrow offset, or HF trend timeframes to match your trading style.
---
D. 🎯 How It Works
1. Trend Check – Uses trend analysis on 4H & Daily to ensure you trade with the dominant market direction.
2. Structure Break – Alerts when price closes beyond the most recent swing high (bullish) or low (bearish).
3. Zone Confirmation – Plots S/R, OB, and FVG zones to help you visualize confluence.
4. Level Calculation – Automatically computes entry, stop, and three target levels based on your RR settings.
5. Visual Signals & Alerts – Draws arrows/labels on the chart and triggers alerts so you never miss a setup.
---
E. 🚀 Getting Started
1. Open Indicators menu on TradingView and search for ParthFintech SMART Indicator.v1.0
2. Click Add to Chart and tweak input settings to your preference.
3. Create alerts on “Buy Signal”, “Sell Signal”, “TP1 Hit”, “SL Hit”, etc., choosing popup, email, or webhook delivery.
Contact: support@parth-fintech.com or visit parth-fintech.com for any queries.
-----
> Disclaimer: This indicator is provided for personal use and should be tested thoroughly in a demo environment before deploying with real capital. Always manage your risk appropriately.

Midnight 30min High/LowMidnight 30min High/Low — Overnight Liquidity Range Tracker
Capture the Overnight Session: A Strategic Level Identification Tool from Professional Trading Methodology
This indicator captures the high and low prices during the critical 30-minute midnight session (12:00-12:30 AM EST) and projects these levels forward as key support and resistance zones. These overnight ranges often contain significant liquidity and serve as crucial reference points for intraday price action, representing areas where institutional activity may have established important levels.
🔍 What This Script Does:
Identifies Critical Overnight Session Levels
- Automatically detects the 12:00-12:30 AM EST session window
- Captures the highest and lowest prices during this 30-minute period
- Projects these levels forward for multiple trading days
Creates Dynamic Support/Resistance Zones
- Extends midnight high/low levels as horizontal lines with customizable projection periods
- Fills the area between high and low to create a visual trading range
- Updates automatically each trading day with new overnight levels
Provides Clear Visual Reference Points
- Optional session start markers (●) highlight when the midnight session begins
- Color-coded lines distinguish between high and low levels
- Transparent fill area creates an easy-to-identify trading zone
Real-Time Level Tracking
- Updates levels in real-time during the active midnight session
- Maintains historical levels for reference and backtesting
- Compatible with data window for precise level values
⚙️ Customization Options:
Extend Days (1-30):** Control how many days forward the levels are projected (default: 5 days)
High Line Color:** Customize the midnight high line color (default: blue)
Low Line Color:** Customize the midnight low line color (default: orange)
Fill Color:** Adjust the transparency and color of the range area (default: light aqua, 80% transparency)
Show Session Markers:** Toggle yellow session start indicators on/off (default: enabled)
💡 How to Use:
Deploy on lower timeframes (1m-15m) for precise level identification and reaction monitoring**
Watch for key price interactions:
- Rejection at midnight high levels (potential resistance)
- Bounce from midnight low levels (potential support)
- Range-bound trading between the high and low levels
Combine with liquidity concepts:
- Monitor for stop hunts above/below these levels
- Look for false breakouts that snap back into the range
- Use as confluence with other ICT concepts like FVGs and Order Blocks
Strategic Applications:
- Range trading between midnight levels
- Breakout confirmation when price closes decisively outside the range
- Support/resistance validation for entry and exit planning
🔗 Combine With These Tools for Complete Market Structure Analysis:
✅ First FVG — Opening Range Fair Value Gap Detector.
✅ ICT Turtle Soup (Liquidity Reversal)— Spot stop hunts and false breakout scenarios
✅ ICT Macro Zones (Grey Box Version)- It tracks real-time highs and lows for each Silver Bullet session
✅ ICT SMC Liquidity Grabs and OBs- Liquidity Grabs, Order Block Zones, and Fibonacci OTE Levels, allowing traders to identify institutional entry models with clean, rule-based visual signals.
Together, these tools create a comprehensive Smart Money Concepts (SMC) framework — helping traders identify, anticipate, and capitalize on institutional-level price movements with precision and confidence during critical overnight sessions.

Mohammad - OBs, BOS, S/R, Elliott Waves & Trend LinesProfessional Trading Indicator System - Technical Analysis Suite
Overview
Advanced technical analysis system integrating ICT/SMC methodologies with classical analysis tools. Features seven analytical components for comprehensive market structure analysis.
Components
1. Order Blocks (ICT/SMC)
Identifies institutional accumulation/distribution zones acting as future support/resistance.
Detection: Automatic identification based on price rejection patterns
Management: Dynamic updates and removal of invalidated blocks
Configuration: Sensitivity levels (High/Medium/Low), ATR-based parameters
Visual: Green support, red resistance with transparency
2. Break of Structure (BOS)
Detects significant structural breaks indicating trend changes.
Method: 5-bar swing point formation
Display: White horizontal lines with labels
Range: 50-bar maximum lookback
3. Support & Resistance
Classical horizontal levels from significant price pivots.
Analysis: 300-bar historical scan
Filter: 10-point duplicate tolerance
Display: Maximum 15 levels within 5% of current price
4. Fair Value Gaps (FVG)
Price inefficiencies that often get filled on return.
Types: Bullish gaps (up) and bearish gaps (down)
Size: Minimum 0.1 ATR or 5 points
Management: Auto-removal when filled
5. Elliott Wave Analysis
Advanced pattern recognition for impulse and corrective waves.
Patterns: 5-wave impulse (1-2-3-4-5), 3-wave corrective (A-B-C)
Adaptive: Auto-adjusts to timeframe (3-10 depth range)
Display: Small dots with large numbers, starts from hidden point 0
6. 45-Degree Momentum Lines
Revolutionary projection system based on consecutive candle sequences.
Bearish Lines (Red):
Trigger: 5+ consecutive red candles
Start: HIGH of first red candle
Labels: B1-B5
Bullish Lines (Green):
Trigger: 5+ consecutive green candles
Start: LOW of first green candle
Labels: T1-T5
Specifications:
Angle: 45° using ATR * 0.15
Extension: 30 bars forward
Display: 5 most recent patterns
7. Classical Trend Lines
Multi-touch diagonal support/resistance detection.
Validation: Minimum touch requirements
Tolerance: ATR-based touch detection
Display: Blue lines with optional labels
Configuration Summary
Global Settings:
Show/hide each component individually
Customizable colors and line widths
Label size options
Performance:
50-bar periodic cleanup
Maximum object limits (500 each)
Conditional processing on bar close
Trading Applications
Scalping: Order Blocks + FVGs + 45° Lines
Day Trading: All components with BOS emphasis
Swing Trading: Elliott Waves + Trend Lines
Position Trading: Major levels + Elliott Waves
Key Strategies:
Use 45° line bounces for entries
Combine Order Blocks with 45° lines for confluence
Confirm BOS breaks with 45° line violations
Place stops beyond projection lines
Technical Requirements
Platform: TradingView Pine Script v5
Minimum: 300 historical bars
Optimal: 15m-4H timeframes
Performance: Moderate CPU usage
Color Scheme
Green: Bullish/Support (#26a69a)
Red: Bearish/Resistance (#ef5350)
White: BOS/S&R lines
Blue: Elliott Waves/Trend Lines
Customizable: 45° projection lines
Risk Disclaimer
Educational tool only. Not financial advice. Combine with risk management and personal analysis. Past performance doesn't guarantee future results. Trading involves substantial risk.

ICT Sensitive Key Levels [Mariinus]Indicator Overview – Inspired by ICT Concepts
This indicator is inspired by the teachings of Inner Circle Trader (ICT), whose philosophies and principles have greatly shaped the way I view price action. One of the most powerful lessons that stuck with me is his quote:
"All you need is OHLC."
Another fundamental concept that underpins this tool is the idea that:
"Price is constantly moving in cycles from Premium or Discount to Equilibrium, from Equilibrium to Discount to Premium."
With these core ideas in mind, this indicator was developed to help traders who are already using an ICT-based framework. In addition to plotting the standard OHLC levels, the ICT Sensitive Key Levels indicator also includes derived levels that provide deeper Market insight. These include the Equilibrium of the full candle range (High to Low) as well as the Equilibrium of the wicks – offering a more nuanced view of price balance and potential turning points, in line with ICT’s core concepts.
⚠️ Important Disclaimer:
This is not a standalone trading plan.
This is not a buy or sell signal generator.
Instead, this tool is designed to support traders who follow ICT principles by helping them identify higher-probability PD Arrays – the key zones where setups are more likely to occur. If your trading plan includes looking for specific PD Arrays and structural frameworks taught by ICT, then this indicator is a visual aid to refine and focus your attention on the areas where your framework has a higher probability of playing out.
🔁 Backtesting & Daily Preparation
In addition to improving your real-time analysis, this indicator is also a valuable tool for accelerated backtesting . Rather than manually drawing out levels, the indicator automatically provides them, allowing you to analyze past price action faster and more efficiently .
It’s also ideal for preparing your trading day . By loading the indicator before the session starts, you get a clear visual of key levels that may play a role in your strategy. And if you find the chart too cluttered with lines, simply copy the ones that matter to you, draw them manually, and then turn the indicator off to keep your chart clean while keeping your zones intact.
⚙️ Explanation of the Settings
You can combine up to 4 timeframes to monitor their respective levels while operating on a lower timeframe. For each timeframe, you can:
• Set a lookback period to control how far back you want to calculate levels.
• Choose to display or hide the levels of the current candle , which helps you monitor intra-candle ebbs and flows.
Each level (e.g., High, Low, Open, Close, Equilibrium) can be customized:
• Color
• Line style
• Line width
• To hide a level , simply set its opacity to zero.
You can also enable dividers to clearly mark the start and end of higher timeframe candles on your lower timeframe chart. These dividers are also fully customizable:
• Color
• Style
• Width
• And again, if you prefer a cleaner chart, you can set the opacity to zero to hide them completely.
This setup gives you full control over how much or how little visual data you want to see, aligning the tool with your personal trading workflow.
💡 Example Use Cases
These examples are for educational purposes only. This tool is not financial advice and should always be used in conjunction with your own trading plan—whether it involves Fair Value Gaps, Order Blocks, or a custom combination of ICT-based elements.
• Example 1: A 1H Bearish Fair Value Gap overlapping with the Equilibrium Key Level of the Previous Day's Range – a high-probability zone for reaction.
• Example 2: A 1H Bullish Fair Value Gap in Discount, overlapping with the Equilibrium of Two Days Ago, followed by a move into a 1H Bearish Order Block that coincides with the Previous Day’s Equilibrium.
• Example 3: The same 1H PD Arrays viewed from a 4H chart, alongside Weekly Price Levels – giving you a higher timeframe context that supports or invalidates lower timeframe setups.
• Example 4: A combination of two timeframes for added context. A 4H Bullish Fair Value Gap is nested inside the current Weekly Equilibrium Key Level . On the 15M chart , we observe a reaction that creates an Inversion Fair Value Gap , which aligns with the Equilibrium Key Level of the previous 4H candle .
This indicator doesn’t replace your trading plan—it enhances your ability to execute it. It’s a precision tool made for ICT traders who understand context, structure, and probability.

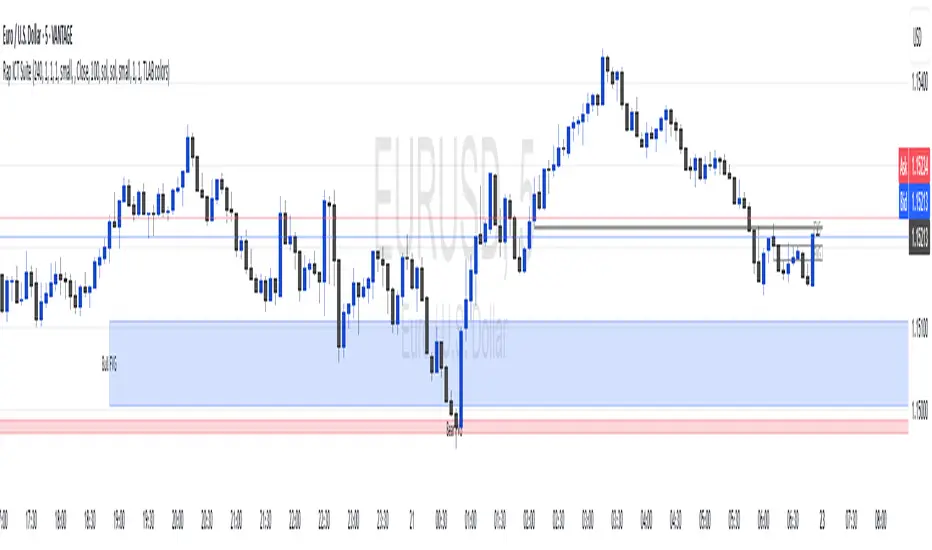
Rapid ICT Suite - MTF Concepts & iFVGTitle: Rapid ICT Suite - MTF Concepts & iFVG
Overview
Unlock a new level of market analysis with the Rapid ICT Suite, a comprehensive, all-in-one indicator designed for the discerning price action trader. This powerful tool merges two distinct analytical engines into one seamless experience, allowing you to overlay critical Higher Timeframe (HTF) market structure onto your current chart while simultaneously tracking real-time Fair Value Gaps (FVGs) and their inversions (iFVGs).
Whether you are a scalper needing to respect 1H structure, a day trader aligning with the 4H bias, or a swing trader mapping the daily trend, this indicator provides the clarity and context you need to make higher-probability trading decisions. It was built from the ground up to solve common issues traders face, delivering stable, precise, and flexible analysis.
The Strategy: Targeting IRL with iFVG Entries
The Destination (The "Why"): Internal Range Liquidity (IRL)
On a Higher Timeframe (HTF), we will identify major Internal Range Liquidity (IRL) zones. In the context of ICT, IRL simply refers to unmitigated Fair Value Gaps (FVGs) that exist within a broader trading range.
These HTF FVGs act as powerful magnets for price. The market will often seek out these zones to rebalance before continuing its next major move. By plotting these on our chart, we establish a clear directional bias and a high-probability target. Our indicator will now label these HTF FVG boxes as "IRL".
The Entry Signal (The "How"): Inverted Fair Value Gaps (iFVG)
Once we have our HTF IRL target, we drop down to our Lower Timeframe (LTF) for execution.
We wait for price to create an Inverted Fair Value Gap (iFVG). An iFVG is a regular FVG that has failed and been traded through, signifying a shift in momentum.
An iFVG appearing on the LTF provides a high-precision entry signal to take a trade in the direction of the HTF IRL zone. It's our confirmation that the market is likely now making its move towards that destination.
Key Features
Multi-Timeframe Order Blocks (Boxes): Automatically identify and plot key HTF demand and supply zones (Order Blocks) onto your chart.
Multi-Timeframe Fair Value Gaps (Boxes): See where HTF imbalances exist, giving you a clear map of institutional reference points and potential targets.
Multi-Timeframe Liquidity Pools (Boxes): Pinpoint where buy-side and sell-side liquidity is likely resting, based on clusters of old highs and lows.
Current Timeframe FVG & iFVG (Lines/Labels): A second, independent engine tracks FVGs on your chosen timeframe, monitors them for mitigation, and automatically identifies when an FVG has been inverted (iFVG), a crucial shift in market dynamics.
The "Rapid" Advantage: Solving Trader Frustrations
This indicator was engineered to overcome three of the most common problems with technical indicators:
1. ✅ No More Flickering or "Ghost" Signals
The Problem: Many indicators show signals on the live, forming candle. This causes zones or signals to appear and disappear ("flicker"), leading to confusion and false entries.
The Solution: The Rapid ICT Suite uses 100% confirmed, closed-candle data for all its calculations (OB, FVG, and Liquidity). A zone will only appear on your chart after the price action that confirms it is complete. This means every signal is stable, reliable, and non-repainting.
2. ✅ Frame-Perfect, Precise Placement
The Problem: Indicators that use lookback logic often draw their signals one candle too late, causing a visual disconnect between the price pattern and the signal itself.
The Solution: We have corrected this common flaw. Every box and line is drawn starting from the exact confirmation candle of the pattern. This frame-perfect precision is critical for accurate analysis and planning your entries.
3. ✅ The Dual Analysis Engine: Uncluttered & Flexible
The Problem: Trying to analyze multiple timeframes at once can lead to cluttered charts and mental overload .
The Solution: This suite contains two independent parts that you can control separately.
Part 1 gives you the macro context—the HTF structure where big moves originate.
Part 2 gives you the micro details—the real-time FVG and iFVG story on your trading timeframe.
Use them together for a complete picture, or toggle one off to focus on a specific aspect of your strategy. This flexibility keeps your workspace clean and your analysis sharp.
How to Use & Settings Explained
The indicator settings are neatly organized into two main parts.
Part 1: MTF Concepts (OB, FVG, Liq)
This section controls the Higher Timeframe boxes that are overlaid onto your current chart.
Higher-TF for OB/FVG/Liq: This is the most important setting. Select the higher timeframe you want to analyze. For example, if you are trading on the 15-minute chart, you might set this to 240 (4-Hour) to see the key 4H zones.
Show Order-Blocks / FVGs / Liquidity: Simple toggles to turn each type of HTF zone on or off.
Max... Count: Controls how many of the most recent zones are displayed on the chart, preventing clutter from old, irrelevant zones.
Part 2: FVG & iFVG (Lines/Labels)
This section controls the second engine, which analyzes FVGs and iFVGs on its own selected timeframe.
Timeframe for FVG/iFVG: Choose the timeframe for this analysis. You can leave it blank to use your current chart's timeframe, or set it to a specific one.
Mitigation Type & Mitigation %: A powerful feature to define when an FVG is considered "used up."
Type: Choose if mitigation is counted from the candle's Wick or Close.
Percent: Set how far price must retrace into an FVG (e.g., 50%) before it is considered mitigated and the lines are removed from your chart.
FVG/iFVG Count: Controls how many of the most recent FVG/iFVG zones are displayed.
Style & Color Settings: Fully customize the appearance of the lines and labels to match your chart theme.
Final Words
This indicator was built to provide actionable clarity. By understanding the interplay between higher-timeframe structure and current price action, you can significantly enhance your trading edge. Thank you for choosing the Rapid ICT Suite.
Happy trading!
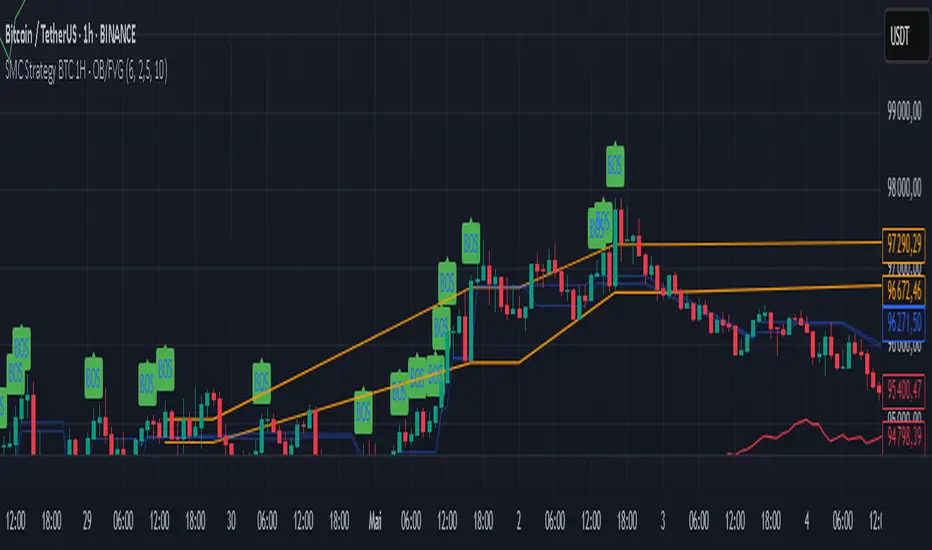
SMC Strategy BTC 1H - OB/FVGGeneral Context
This strategy is based on Smart Money Concepts (SMC), in particular:
The bullish Break of Structure (BOS), indicating a possible reversal or continuation of an upward trend.
The detection of Order Blocks (OB): consolidation zones preceding the BOS where the "smart money" has likely accumulated positions.
The detection of Fair Value Gaps (FVG), also called imbalance zones where the price has "jumped" a level, creating a disequilibrium between buyers and sellers.
Strategy Mechanics
Bullish Break of Structure (BOS)
A bullish BOS is detected when the price breaks a previous swing high.
A swing high is defined as a local peak higher than the previous 4 peaks.
Order Block (OB)
A bearish candle (close < open) just before a bullish BOS is identified as an OB.
This OB is recorded with its high and low.
An "active" OB zone is maintained for a certain number of bars (the zoneTimeout parameter).
Fair Value Gap (FVG)
A bullish FVG is detected if the high of the candle two bars ago is lower than the low of the current candle.
This FVG zone is also recorded and remains active for zoneTimeout bars.
Long Entry
An entry is possible if the price returns into the active OB zone or FVG zone (depending on which parameters are enabled).
Entry is only allowed if no position is currently open (strategy.position_size == 0).
Risk Management
The stop loss is placed below the OB low, with a buffer based on a multiple of the ATR (Average True Range), adjustable via the atrFactor parameter.
The take profit is set according to an adjustable Risk/Reward ratio (rrRatio) relative to the stop loss to entry distance.
Adjustable Parameters
Enable/disable entries based on OB and/or FVG.
ATR multiplier for stop loss.
Risk/Reward ratio for take profit.
Duration of OB and FVG zone activation.
Visualization
The script displays:
BOS (Break of Structure) with a green label above the candles.
OB zones (in orange) and FVG zones (in light blue).
Entry signals (green triangle below the candle).
Stop loss (red line) and take profit (green line).
Strengths and Limitations
Strengths:
Based on solid Smart Money analysis concepts.
OB and FVG zones are natural potential reversal areas.
Adjustable parameters allow optimization for different market conditions.
Dynamic risk management via ATR.
Limitations:
Only takes long positions.
No trend filter (e.g., EMA), which may lead to false signals in sideways markets.
Fixed zone duration may not fit all situations.
No automatic optimization; testing with different parameters is necessary.
Summary
This strategy aims to capitalize on price retracements into key zones where "smart money" has acted (OB and FVG) just after a bullish Break of Structure (BOS) signal. It is simple, customizable, and can serve as a foundation for a more comprehensive strategy.
FVG + OB + RSI Divergence + Volume Spikes🧠 FVG + OB + RSI Divergence + Volume Spikes – Market Structure Confluence Tool
This all-in-one indicator brings together four powerful market concepts into a single script designed to help traders identify high-probability trade setups with precision and clarity:
🔍 What It Does
✅ Fair Value Gaps (FVG)
Highlights inefficiencies in price action, showing where the market may return to “rebalance.”
✅ Order Blocks (OB)
Marks key institutional footprints — bullish and bearish order blocks based on engulfing candle structures.
✅ RSI Divergence
Detects both bullish and bearish divergences between price and RSI, signaling potential reversals.
✅ Volume Spikes
Flags bars where volume significantly exceeds the average — a common footprint of smart money.
🎯 How to Use
Use this tool to spot confluences between price inefficiencies (FVG), key reversal zones (OB), momentum shifts (RSI Divergence), and institutional interest (Volume Spikes). The best setups often occur when multiple signals align — especially at key support/resistance or trend zones.
⚙️ Inputs
RSI length (for divergence)
Volume spike sensitivity (multiplier)
Lookback for Order Blocks and FVGs
⚠️ Notes
This is a non-repainting tool.
Ideal for price action, SMC, ICT, and order flow traders.
Combine with your existing strategy and higher time frame bias for best results.

Market Structure HH, HL, LH and LLMarket Structure Indicator (HH, HL, LH, LL) – Explanation and Usage
Overview:
This indicator is designed to detect and visualize market structure shifts by identifying Higher Highs (HH), Higher Lows (HL), Lower Highs (LH), and Lower Lows (LL). It plots a ZigZag structure to mark trend changes, helping traders analyze price swings and market direction.
Indicator Logic:
The indicator operates based on ZigZag swing points to define trend shifts and structure changes.
Identifying Market Swings:
It finds local highs and lows using the ZigZag Length (zigzag_len), which defines how many bars back to check for a new swing high/low.
If the current high is the highest over zigzag_len periods, it marks it as a swing high.
If the current low is the lowest over zigzag_len periods, it marks it as a swing low.
Determining Market Structure:
Uptrend: Higher Highs (HH) & Higher Lows (HL)
Downtrend: Lower Lows (LL) & Lower Highs (LH)
The script continuously tracks the last two highs (h0, h1) and last two lows (l0, l1) to classify the current market structure.
Visual Elements:
ZigZag Line (Optional): Connects major swing highs and lows for trend visualization.
Labels (HH, HL, LH, LL):
HH (Higher High) – Price is making new highs → Uptrend Continuation.
HL (Higher Low) – Price forms a higher bottom → Uptrend Confirmation.
LL (Lower Low) – Price is making new lows → Downtrend Continuation.
LH (Lower High) – Price forms a lower top → Downtrend Confirmation.
Breakout Confirmation with Fibonacci Factor (Optional)
The indicator includes an option to confirm breakouts using the fib_factor, which ensures price moves beyond a certain retracement level.
How to Use This Indicator in Trading:
1. Identifying Trends & Trend Reversals
Uptrend: Look for a sequence of HH and HL.
Downtrend: Look for a sequence of LL and LH.
Trend Reversal: If price transitions from HH-HL to LH-LL, it signals a shift from an uptrend to a downtrend (and vice versa).
2. Confirming Entry & Exit Points
Buy Entry (Long Position)
Enter after a Higher Low (HL) is confirmed in an uptrend.
Combine with support zones or moving averages for confirmation.
Sell Entry (Short Position)
Enter after a Lower High (LH) is confirmed in a downtrend.
Combine with resistance zones or moving averages for confirmation.
Exit Strategy
Exit long trades when price fails to make a HH and forms an LH instead.
Exit short trades when price fails to make a LL and forms an HL instead.
3. Spotting Breakouts & Order Blocks
The Fib Factor setting allows traders to filter false breakouts by confirming price movement beyond a retracement threshold.
Potential Order Blocks can be identified by looking at the last major swing point before a breakout.
Benefits of This Indicator for Traders
✅ Trend Identification: Helps traders quickly determine if the market is in an uptrend or downtrend.
✅ Clear Market Structure Labels: Easily visualizes Higher Highs, Higher Lows, Lower Highs, and Lower Lows.
✅ Avoids Noise: The ZigZag algorithm removes small fluctuations and focuses on significant market movements.
✅ Assists with Entry & Exit Decisions: Provides objective signals for trend continuation or reversals.
✅ Works in All Markets: Useful for stocks, forex, crypto, and futures trading.
Would you like me to add additional features like Order Blocks, Breakout Confirmation, or Alerts to improve this indicator? 🚀

Market Structure Break Targets [UAlgo]The "Market Structure Break Targets " indicator is designed to identify and visualize key market structure points such as Market Structure Breaks (MSBs) and Break of Structures (BoS). These points are crucial for understanding market trends and potential reversal zones. By plotting these structures on the chart, traders can easily spot significant support and resistance levels, as well as potential entry and exit points.
This indicator uses a combination of swing highs and lows to determine market structures and calculates targets based on user-defined percentages or Average True Range (ATR) multipliers. It provides visual cues in the form of lines, labels, and boxes to help traders quickly interpret market conditions.
🔶 Key Features
Customizable Swing Length: Users can set the swing length to identify the pivot highs and lows, which are crucial for determining market structure.
Target Duration Bars: Defines the maximum duration (in bars) for which the targets will be considered valid.
Target Calculation Methods: The target levels are crucial for setting potential price objectives. The calculation can be based on a percentage move from the identified pivot or using the ATR to factor in market volatility. These targets help in setting realistic profit-taking levels or identifying stop-loss placements.
Bullish and Bearish Market Structure Break (MSB): Detects and highlights bullish and bearish market structure breaks with customizable colors and target percentages.
Bullish MSB
When the price closes above a significant pivot high, a bullish MSB is identified. The indicator will draw a line at this level and calculate a target based on the chosen method (percentage or ATR). The target is visualized with a dotted line, and a label "MSB" is displayed. Additionally, an order block is created at the level of the bullish MSB. This order block is highlighted with a semi-transparent box, representing a potential area where price might find support in the future.
Bearish MSB
Conversely, when the price closes below a significant pivot low, a bearish MSB is marked. Similar to bullish MSBs, targets are calculated and displayed on the chart. An order block is also generated at the level of the bearish MSB, visualized with a semi-transparent box. This box highlights a potential resistance area where price might face selling pressure.
Bullish and Bearish Break of Structure (BoS): Identifies break of structures for both bullish and bearish scenarios, providing additional target levels.
Bullish BoS
If the price continues to rise and breaks another significant level, a bullish BoS is detected. This break is also marked with lines and labels, providing additional target levels for traders. An order block is created at the BoS level, serving as a potential support zone.
Bearish BoS
If the price falls further after a bearish MSB, a bearish BoS is identified and visualized similarly. The indicator creates an order block at the BoS level, which acts as a potential resistance zone.
🔶 Disclaimer:
Use with Caution: This indicator is provided for educational and informational purposes only and should not be considered as financial advice. Users should exercise caution and perform their own analysis before making trading decisions based on the indicator's signals.
Not Financial Advice: The information provided by this indicator does not constitute financial advice, and the creator (UAlgo) shall not be held responsible for any trading losses incurred as a result of using this indicator.
Backtesting Recommended: Traders are encouraged to backtest the indicator thoroughly on historical data before using it in live trading to assess its performance and suitability for their trading strategies.
Risk Management: Trading involves inherent risks, and users should implement proper risk management strategies, including but not limited to stop-loss orders and position sizing, to mitigate potential losses.
No Guarantees: The accuracy and reliability of the indicator's signals cannot be guaranteed, as they are based on historical price data and past performance may not be indicative of future results.

Brutal scalps [Sublime Traders]The "Brutal Scalps" indicator is designed for both novice and expert traders looking to take advantage of short-term price movements. This powerful tool provides a multi-timeframe trend analysis along with dynamic Take Profit (TP) and Stop Loss (SL) levels, enhancing your trading decisions and risk management.
Features:
Multi-Timeframe Trend Analysis - You get a bird's eye view of the main oscillators on the selected timeframe
Last trade panel - Overview of the last trade values: TPs, SL and entry along with a quick stat on the performance over the last 10 trades
Baseline - MA based on either volatility or volume . Changes color depending on the angle and the consolidation area threshold that can be modified.
ATR(Average True Range) dynamic take profits and stop losses
Trend color - Can be enabled to highlight local trend start and end
Leverage setting
This setting is used to send a leverage amount with your alerts, this can be useful if you send your alerts though webhooks.
Signalling type - Classic
The original Brutal scalps signal detection mechanism based on order block/ engulfing candle detection only. Conditions in the MTF trend analysis panel must be met.
Signalling type - Breakout
Prioritizes candle formation that break a given number of candle formation(Eg. Highest high in the last x candles) , combined with the baseline entry condition
Signalling type - Trend following
Angled more towards longer direction moves. Uses adx combined with the price relationship to the 200MA
Key levels zone- Plots the liquidity pockets on the chart
Swing detections- uses moving averages that are plotted in regards to the selected number of candles.
Candle colors - The yellow candles are bullish engulfing candles, while the purple candles are bearish engulfing candles. These candles are also highlighted because their volume exceeds that of the previous 10 candles.
Peak profit - shows a label that displays the highest profit level reached after the signal was triggered , multiplied by the leverage in the input.
How to use:
Brutal Scalps is like your battle plan, you prepare for facing the markets with tools and insights.
1. Use the Multi TF Trend settings to set up the Trend Table in the top right (default position) panel. This will give you an overview of the oscillators in the selected timeframe. You should always watch a higher timeframe than the one you are using on the chart.
Ex.: If you are charting 15m , use the 1hr setting on the trend panel.
2. The baseline is one of the key factors in signal identification, use this wisely. The baseline consolidation threshold is the sensitivity of the line to stagnating candles. If the market is static and no trades come out , it might be because the threshold is set too high. The default of 3 should be a good fit for most setups. Just bare in mind that the higher the threshold the more candles will be considered as a consolidation area. Higher threshold also means better confirmation but also less trades coming in.
3. Signalling types can and should be used in regards to the current market formation.
Examples:
- If a market is moving in a stairs pattern, a good way to tackle it would be through the breakout signalling type.
- When the market is clearly trending, the use of the trend following type is most suited.
- If you want an all-rounder setup that is a jack of all trades but master of nothing, then the Classic type would be the most suited.
Additionally, if the market is extremely undecided and the above types don't perform that well on their own, the use of Allow Opposite Signal Only can reduce losses by only posting trades that are in the opposite direction, no more consecutive buys or sells.
Set the key levels zones to have extra manual confirmation. These zones are based on order blocks and highlight important liquidity areas. While these don't have any direct impact on the signal recognition, they can help to visually validate them.

Structure_TradingHubThe smart money concept suggests that institutional traders have a greater understanding of the market and often have access to more information than retail traders. Therefore, by analyzing market structure, retail traders can align themselves with the actions of smart money and potentially profit from their moves.
This indicator considerably simplifies the process of identification of market structure for traders based on the TradingHUB-3 technical method. Therefore, it is quite different from the existing market structure or trend detection tools, even the other smart-money-based indicators.
How it works:
The indicator starts candlestick analysis from the given start point detecting followings items.
1) Identify valid pullbacks (minor Zigzag):
Uptrend: In the upward trend, each candle that hits a higher high (HH), acts as our checking candle, and if the next candle hits its low, a valid pullback is formed, and we marked the checking candle as the end of a minor leg. Note that we do not take inside bars into account. If the highest point of the leg hit, the lowest point is marked as the end of pullback leg. On the other hand, if the lowest point of the upward leg is hit, the pullback checking procedure is restarted as a downtrend. Note that the downward checking is restarted from the highest point (previous checking candle).
Downtrend: The pullback detection for downtrend follows the reverse procedure of uptrend.
2) Identify inducements (IDM)
The last pullback point (on the minor zigzag) considers as the inducement level. In the uptrend, if the price hit the IDM, the highest point on the major leg is accepted as a major higher high. Note, if the IDM point is equal to a major HL and hit by price, the highest point is accepted as a new HH and the previous HH and LL are deleted (i.e. the HH is transferred).
In the downtrend, it acts conversely.
3) Identify valid break of structures (BOS)
In the uptrend, if the price closed above the highest point between the previous accepted HH to the current candle, a BOS is accrued, and the lowest point in this time interval is accepted as a higher low (HL). In the downtrend, it acts contrariwise.
4) Identify valid change of characters (Choch)
In the uptrend, if the price closed below the lowest point between the previous accepted HL to the current candle, a Choch is accrued, and the major trend changes from uptrend to downtrend, and a new reverse IDM will be detected. In the downtrend, it acts inversely.
5) Identify major HH/HL/LL/LH points
By following the above steps, the major higher highs, higher lows, lower highs, and lower lows, as well as the major trend are detected. The major high and lows on the major trend can be displayed by zigzag style or bullet points with corresponding up/down color.
How to use it:
This indicator works in any chart timeframe, and it does not need much tunning for use. Although, two parameters can be modified:
1- Starting Point:
Mode 1: Go back a certain number of candles in the past to find the starting point.
Mode 2: Use the last major swing that is higher/lower point between X candles right and left.
2- Choch/BOS min ticks' confirmation: The user can set an extra pipettes value that price should close higher/lower than the major H/L for more confirmation.
A trader can use this indicator for trading through the following steps (Of course, the trader is not restricted in these steps and can act according to its trading strategy):
1- Recognize the trend direction by seeing the H/L or zigzag color.
2- Identify the unmitigated IDM, which is marked by "X". When the inducement hit, the level is marked by "IDM", and a major H/L is confirmed.
3- Identify an order block to trade on it. We recommend users to add "OrderBlock_TradingHub " indicator to identify valid order blocks easily according to this technical method.
4- Go to the lower timeframe to find a trigger.
Indicator Options:
1) Set the starting point based on a certain number of candles or a major swing.
2) Show/Hide Pullbacks zigzag
3) Show/Hide Inducements (IDM)
4) Show/Hide Change of Characters (CHoCHs)
5) Show/Hide Break of Structures (BOS)
6) Draw up/down Trend
7) Draw H/L Points (by major Zigzag or Bullets)
8) Set CHoCH/BOS min pipettes for confirmation
9) Change the color and style of elements on the chart

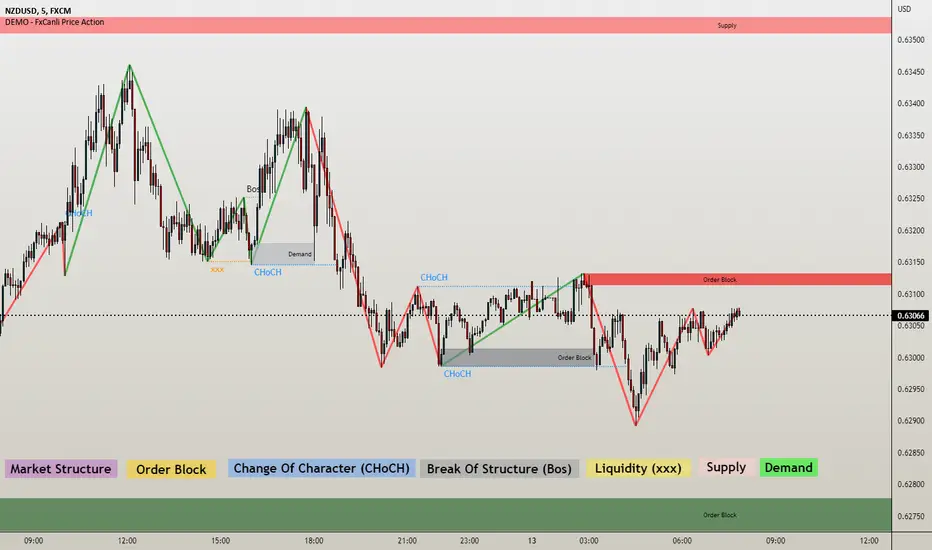
DEMO - FxCanli Price ActionEN - FxCanli TradingView Price Action indicator can draw and alert at everything about PRICE ACTION.
DEMO VERSION of FXCANLI PRICE ACTION Indicator work with any NZD or any DOGE symbols
TR - FxCanli TradingView Price Action indikatörü grafiklerinizde PRICE ACTION ile ilgili tüm çizimleri yapar ve alarm verir.
FXCANLI PRICE ACTION indikatörünün DEMO VERSİYONUNU herhangi bir NZD veya DOGE sembolü ile kullanabilirsiniz.
EN - For Example | TR - Örnek
NZD|...
NZD|USD
NZD|CAD
NZD|CHF
NZD|JPY
DOGE|...
DOGE|USD
DOGE|USDT
DOGE|USDTPERP
DOGE|BTC
EN - FxCanli TradingView Price Action indicator can draw and alert at;
Break of Structure (BOS),
Change of Character (CHoCH),
Liquidity,
Order Block,
Supply & Deman
TR - FxCanli TradingView Price Action indikatörü grafiklerinizde;
Break of Structure (BOS)
Change of Characte (CHoCH)
Liquidity
Order Block
Arz & Talep bölgelerini otomatik olarak çizer ve alarm verir.
Market Structure;
EN - You can easly follow market structure, Up Trend with green waves, Down trend with Red waves
TR - Market yapısını kolayca takip edebilirsiniz. Yukarı trendi yeşil dalgalar ile, Aşağı trendi kırmızı dalgalar ile.
Change of Character (CHoCH)
*************************************
EN - Shows trend reversals
TR - Trend dönüşümlerini gösterir
Break of Structure (BOS)
******************************
EN - Shows trend continuations
TR - Devam eden trendleri gösterir
Liquidity
***********
EN - Shows Liquidity levels
TR - Likidite seviyelerini gösterir
Order Block and Supply&Demend
***************
EN - Shows Order Block and Supply&Demend levels which is a technical analysis technique that tracks the accumulation of orders (when bullish ) and distribution of orders (when bearish ) of banks and institutional traders.
TR - Bankaların ve kurumsalların emir birikimini (yükseliş olduğunda) ve emir dağılımını (düşüş olduğunda) Order Block ve Arz & Talep olarak gösterir.
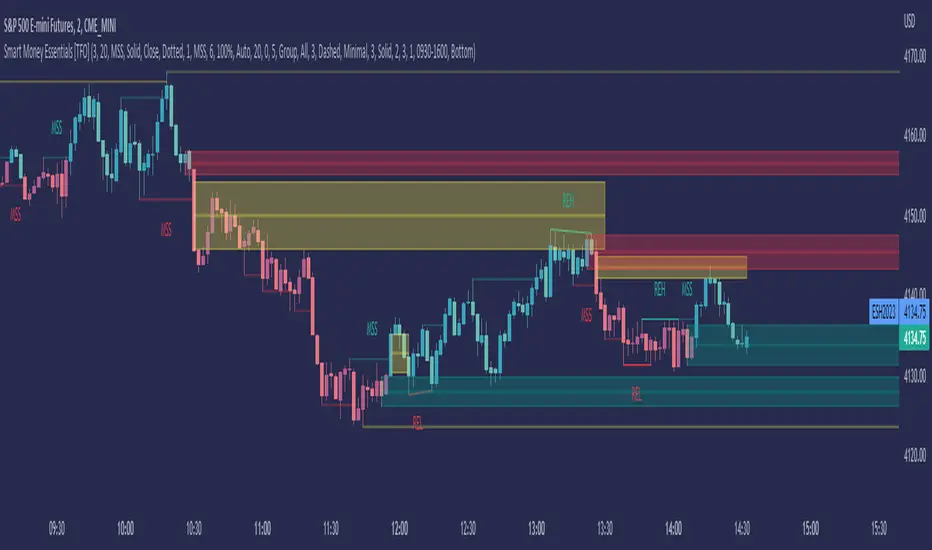
Smart Money Essentials [TFO]This indicator utilizes “Smart Money Concepts” like liquidity, order blocks, premium & discount, and more to analyze price action.
What’s included in the initial release:
Market Structure
Liquidity
Displacement
Order Blocks
Premium / Discount
Confluence Table
Alerts
Market structure logic objectively identifies whether the current trend is bullish or bearish, based on swing highs and lows. Liquidity levels offer insight into major pivots where we can assume many traders may place their stop loss, which can also serve as areas where “Smart Money” may be accumulating or distributing positions.
Displacement adds to this by spotting rapid price movement, often accompanied by imbalances where price may come back to before continuing in the direction of the displacement. These can be filtered based on whether the imbalance is accompanied by a Break of Structure (BOS) or Market Structure Shift (MSS), which may give additional insight into the draw on liquidity.
Order blocks (OB’s) are detected and treated as areas that may offer support for price in an uptrend or resistance in a downtrend. Premium and discount zones are essentially fitted by an “auto-fib” retracement that looks at recent liquidity levels, and optionally offers areas to look for an Optimal Trade Entry (OTE) where price retraces between 62-79% of the preceding displacement leg.
The confluence table provides an organized place to visualize and identify where any of the above concepts may be present at or around the same time. We can implement a threshold where, if the number of selected factors meets or exceeds this threshold, we can potentially identify bullish and bearish opportunities where multiple layers of confluence are overlapping.
And of course, alerts are built in for all significant events related to the above concepts, for example: runs on liquidity, BOS and MSS, rejections from OB and OTE, etc.